Due diligence on energy assets requires pulling together ownership, financial, engineering, and regulatory data from multiple sources. These walkthroughs show how the platform consolidates that into a single asset view.
Who really owns this plant?
“I'm evaluating a solar plant called Childress Solar Park. Who is the actual financial owner behind the registered operator?”
Search for the plant
Search “Childress Solar” on the home page. The search supports name matching, EIA Plant ID, owner name, and state lookup. Use Owner mode to jump straight to an owner's full fleet on the Explore page. Click any plant result to open its detail page.
Check the Ownership section
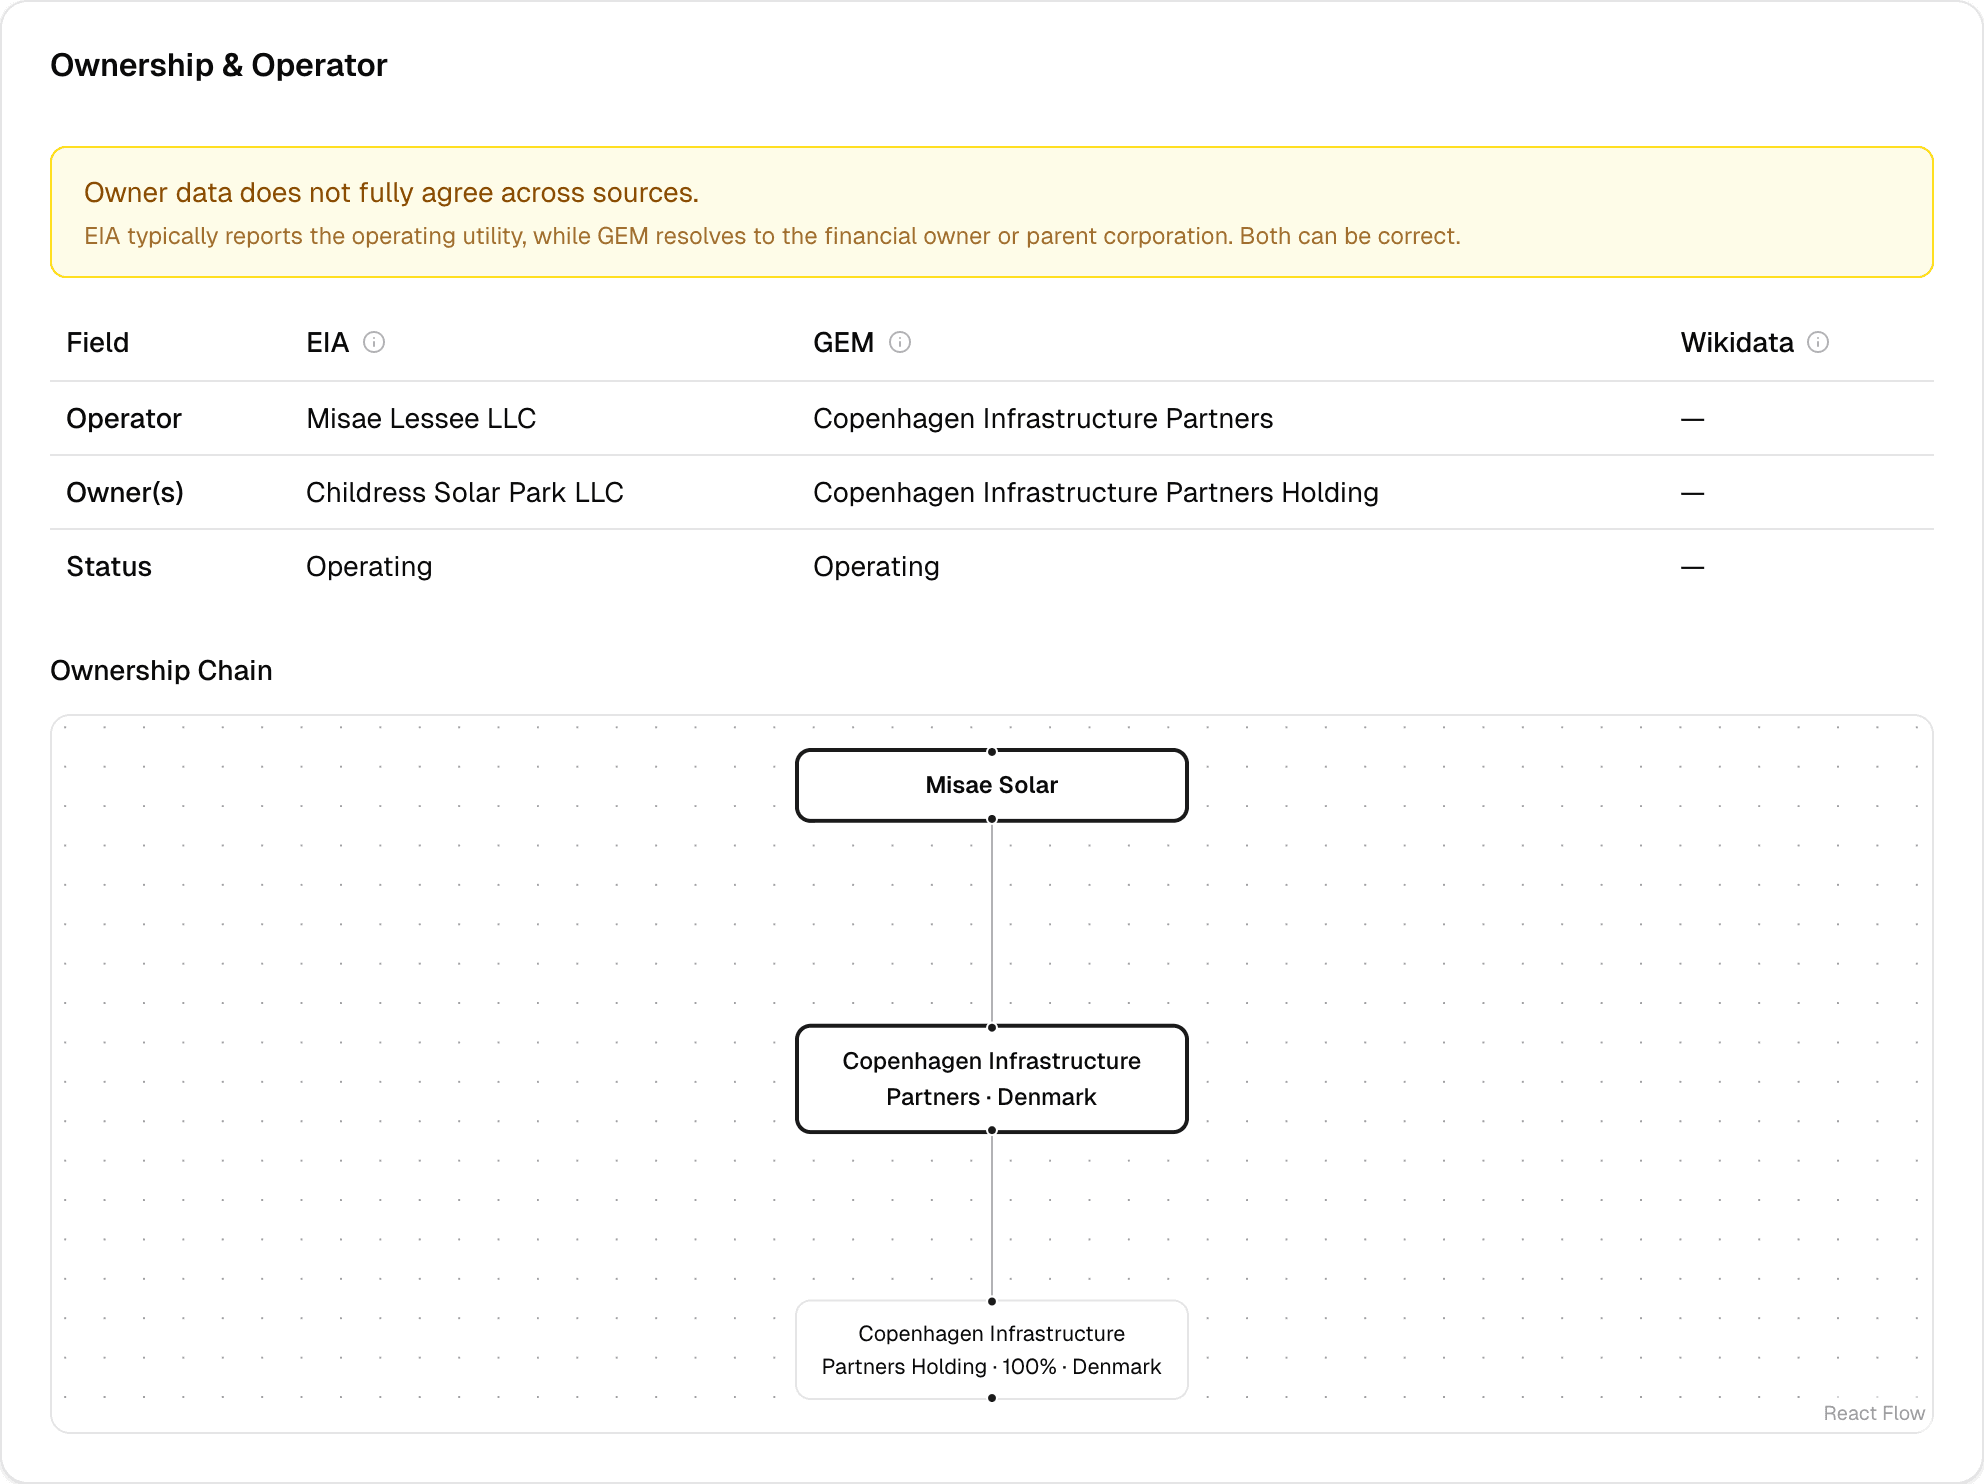
Scroll to the Ownership & Operator section. You'll see a side-by-side comparison table showing what EIA reports vs what GEM (Global Energy Monitor) reports vs what Wikidata shows. Look for the yellow mismatch badge — it flags when sources disagree on the owner name.
Follow the ownership chain
Below the comparison table, the ownership chain diagram (a directed graph) shows the path from the plant entity through subsidiaries to the ultimate parent. Each node shows the entity name and country. For publicly traded parents, institutional shareholders (BlackRock, Vanguard, etc.) appear at the top of the chain.
Cross-reference with news
Check the News section on the same page. Filter by “Deals” category to see if there are recent M&A articles about this plant or its parent company.
Key insight
The EIA-registered operator is often an SPV (special purpose vehicle). The real financial owner is visible via GEM + Wikidata corporate chain resolution. For example, Childress Solar Park is operated by 'Misae Lessee LLC' according to EIA — but GEM resolves the real owner to Copenhagen Infrastructure Partners. 2,320 plants have ownership source disagreements — these are the SPV-masked assets worth investigating.
Is this plant financially competitive?
“What does the financial picture look like for a specific solar or wind plant — installed cost, LCOE, PPA price?”
Navigate to the Financial section
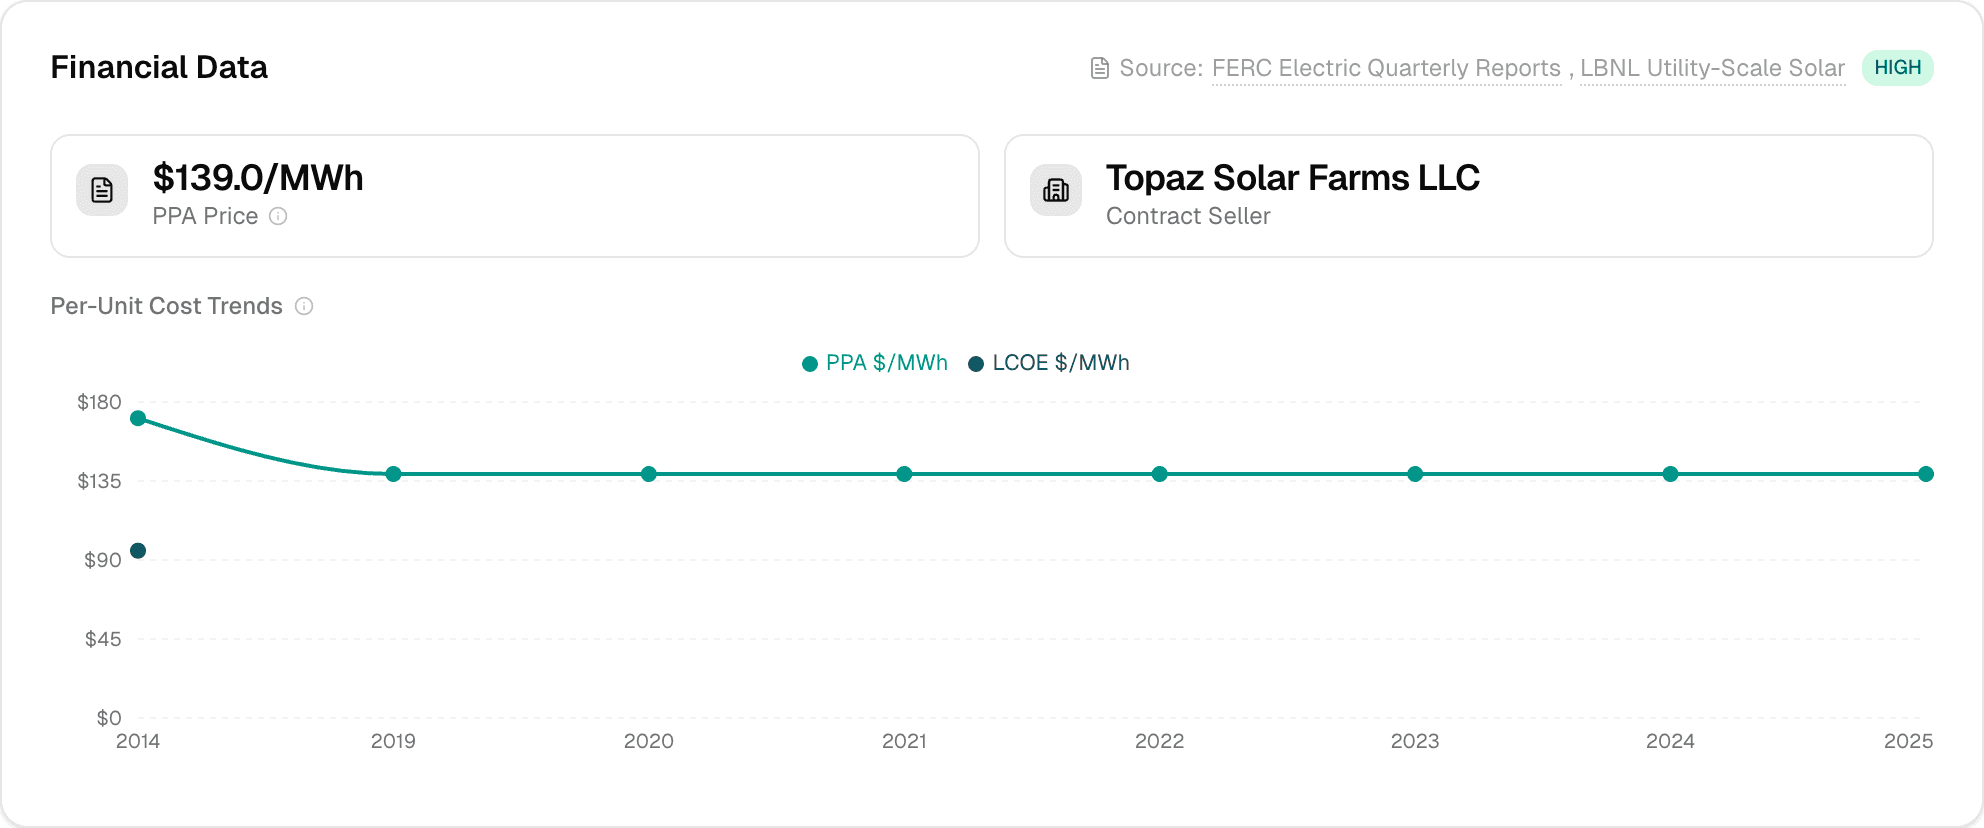
On any plant detail page, scroll to the Financial Overview section. If data is available, you'll see KPI cards showing installed cost ($/kW), operating cost ($/MWh), LCOE ($/MWh), and PPA price ($/MWh).
Check the data confidence
Look at the source badge in the top-right corner of the section. It shows which source provided the data (FERC, LBNL Solar, FERC EQR) and the confidence level: HIGH = audited filings, MEDIUM = contract-matched, LOW = benchmark estimates.
Review the cost trajectory
The charts below the KPIs show three views: annual CapEx additions, cumulative installed cost over time, and per-unit costs ($/kW and $/MWh) as line charts. For solar plants with LBNL data, the LCOE includes federal tax credit adjustments.
Key insight
The platform combines three independent financial sources (FERC Form 1 for regulated utilities, LBNL for solar benchmarks, FERC EQR for wholesale contract prices) into a single view with confidence badges. No other open platform integrates all three at plant-level granularity.
What's the news and regulatory exposure?
“Are there any red flags — hazard incidents, regulatory actions, M&A rumors — for this asset?”
Scan the News section
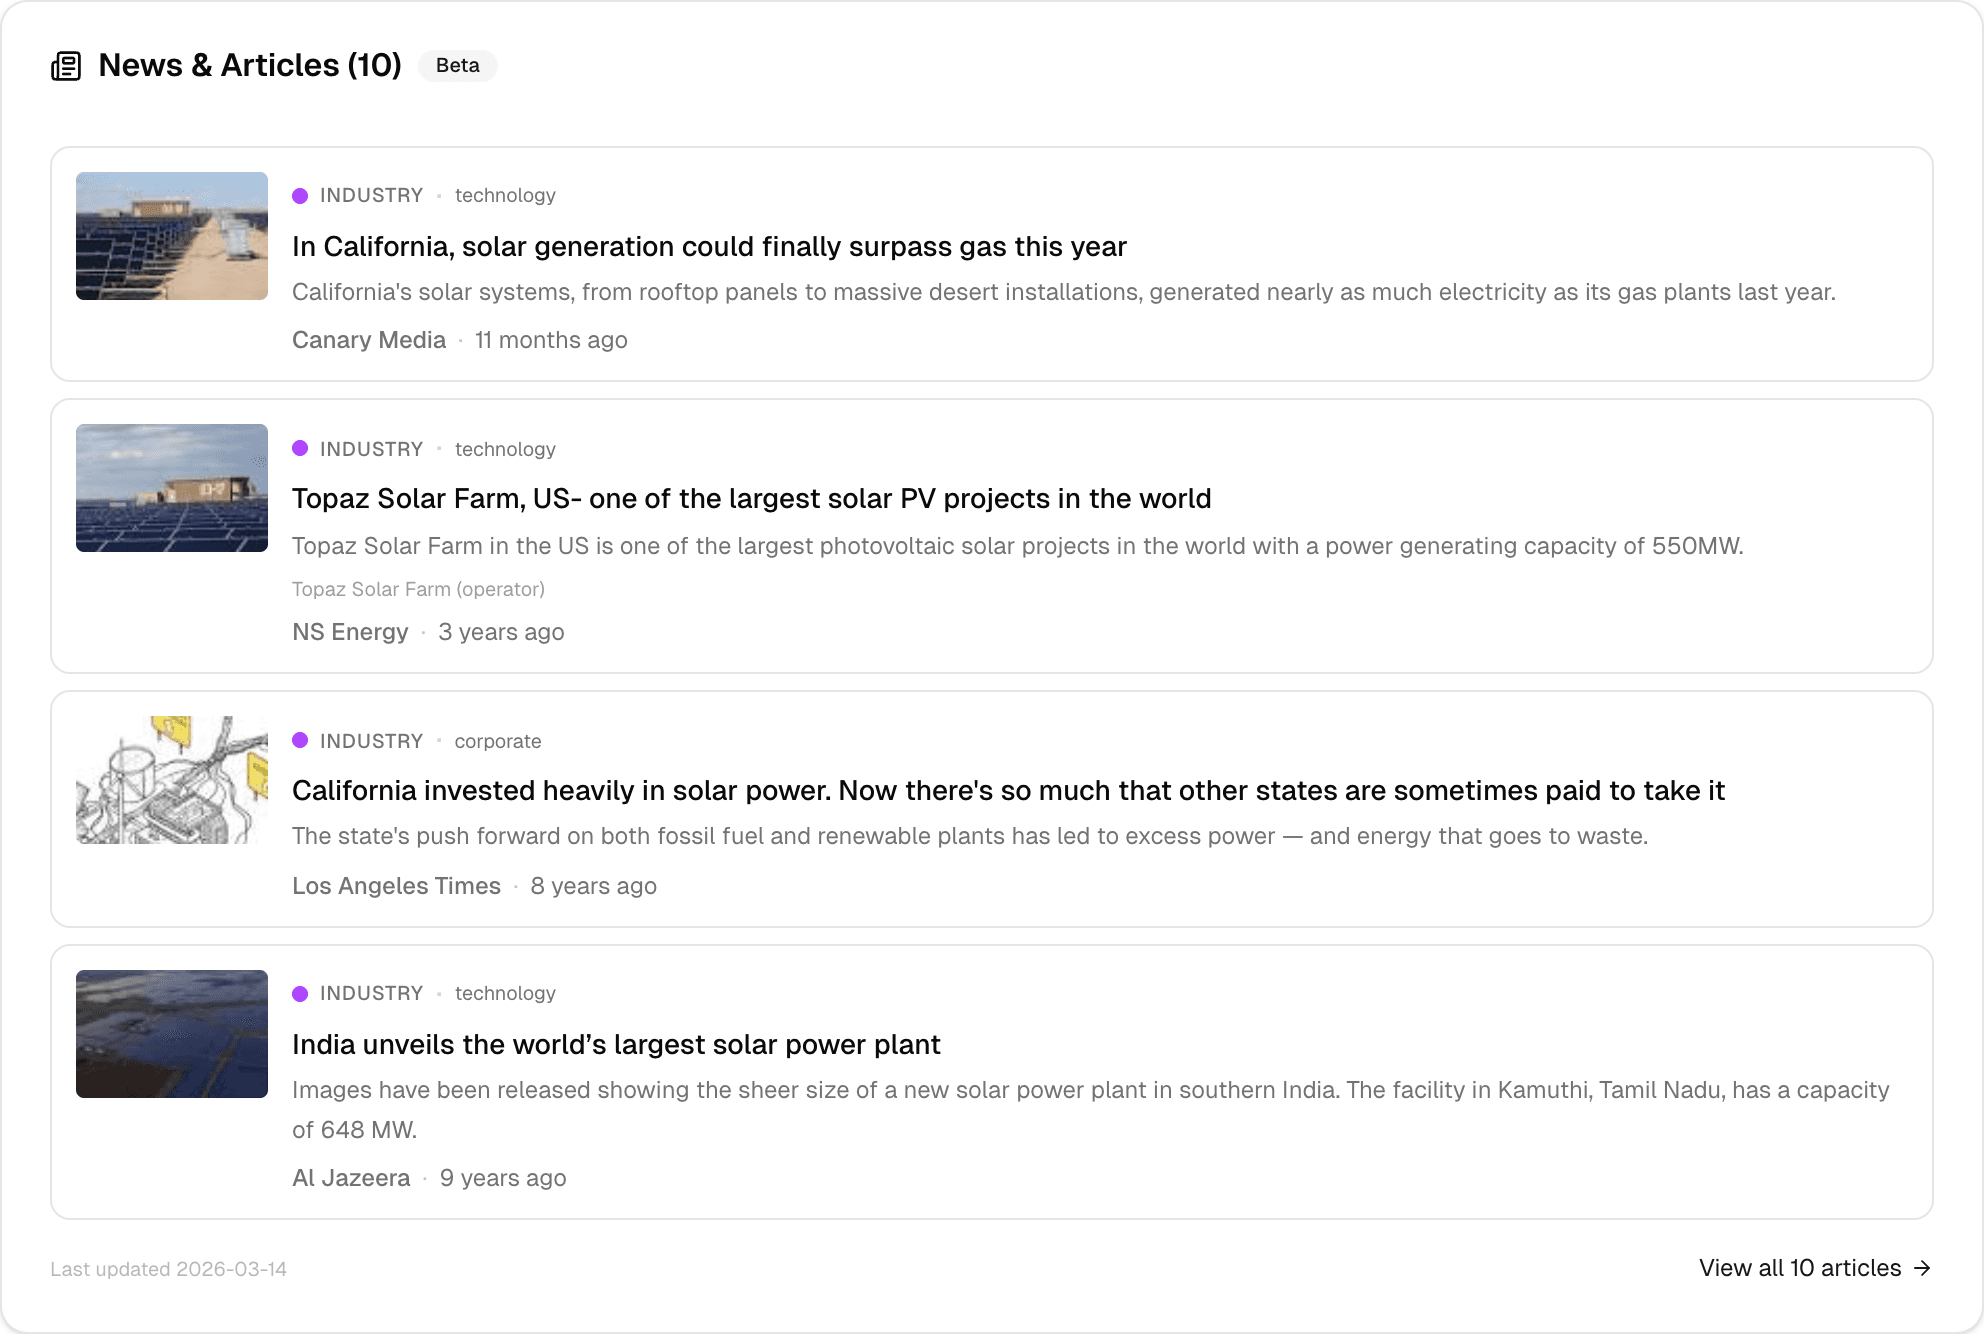
On the plant detail page, the News section shows up to 4 recent articles. Each has a colored dot indicating its category: green = deals, red = hazards, blue = regulatory, amber = grid, purple = industry.
Filter by category
Use the category pills at the top of the News section to focus on a specific type. For due diligence, start with “Hazards” and “Regulatory” to surface potential risks.
Dive into the full news feed
Click “View all articles” to open the dedicated news page filtered to this plant. From there, you can filter by subcategory (e.g., “permitting” under regulatory), search by entity name, or expand the date range.
Key insight
News articles are automatically classified by an LLM into 5 categories (deals, hazards, regulatory, grid, industry) with entity extraction. This surfaces risks without reading every article manually. Filter by category to focus on what matters for your analysis.
What's coming
Planned
PDF export of plant profiles for offline sharing. LMP time-series charts in the Pricing section showing historical nodal prices alongside generation data.
Exploring
AI-generated due diligence summaries that synthesize ownership, financial, generation, and news data into a single narrative. Automated risk scoring that flags plants with declining capacity factors, regulatory exposure, or hazard-prone locations.